In this help article, we will take you through each page in the Maturix Precast web portal.
Maturix Precast is developed specifically for monitoring a precast production. The data from the Maturix transmitters can be viewed in Maturix Precast.
You can log in to the software by writing app.maturix.com in your web browser and entering your login details.
To get access, contact your Maturix admin or your reseller.
Dashboard
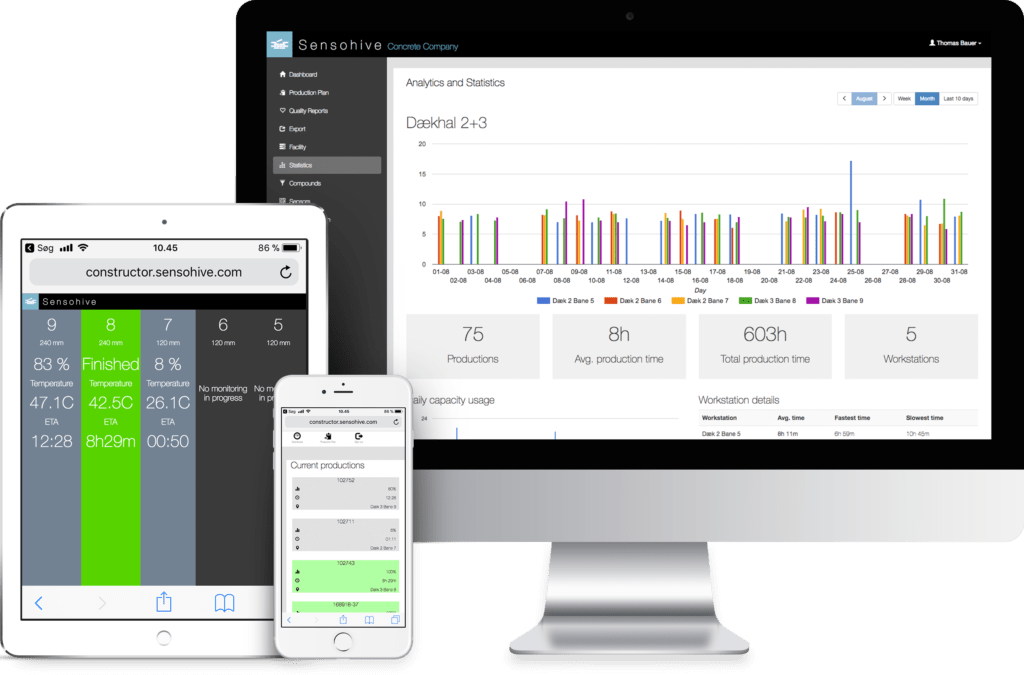
The Dashboard is the main page, which you will see every time you log into Maturix Precast.
The Dashboard provides a visual overview of all your current productions (grey boxes) and recently finished productions (green boxes). “Recently finished” refers to productions that have reached their target strength within the last weekday.
When a production is finished, the box on the Dashboard turns from grey to green, and the report will then be available under Quality Reports from the menu.
The Dashboard can look like this:
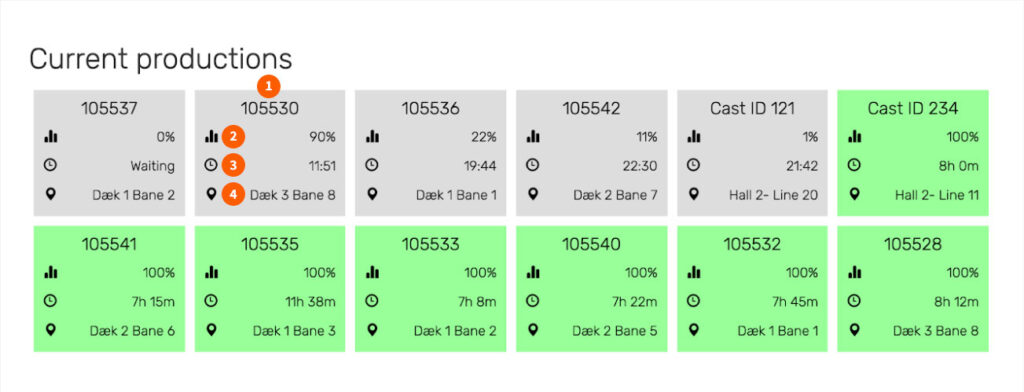
Each box on the dashboard shows:
- Production ID – The name or unique ID of the production
- Status – The progress towards the target (% of maturity)
- Time – The info depends on the status:
Grey box: ETA, the estimated time when the target is reached
Green box: Production time - Workstation – At which workstation the element is being produced and monitored
To see the production data, simply click on one of the boxes on the dashboard. This will take you to the report for that production, where you can see all the data and info, including the temperature history and the strength development.
If your facility is mapped, you will also see a rough visual map of the workstations that have productions being monitored or which have finished recently.
Before you see anything on your Dashboard, you need to add an entry to the Production Plan.
Production Plan
The Production Plan is where you add your productions and start them.
This is how it could look like when you have added some entries:
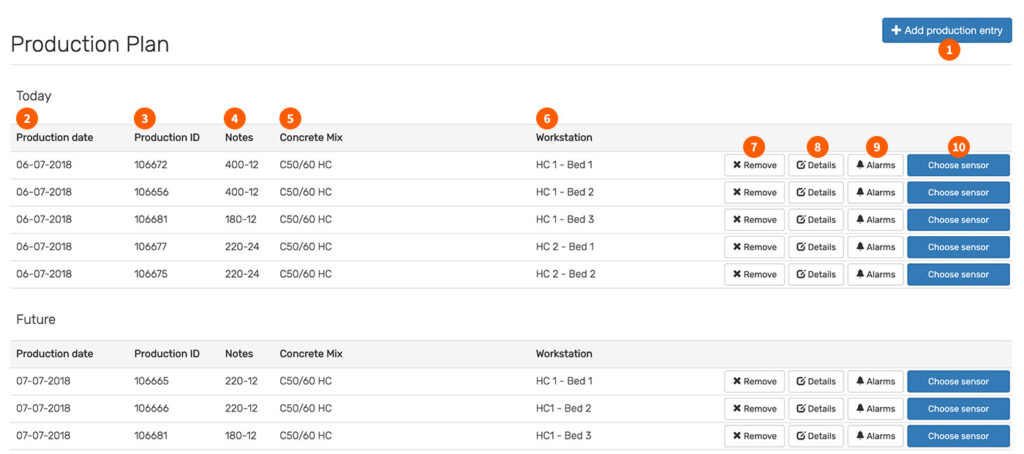
- Button: Add production entry – Click here to add a new entry to the production plan
- Production date – The date the production is intended to start
- Production ID – The name or unique ID of the production
- Notes – Additional info added
- Concrete Mix – The concrete mix calibration used
- Workstation – At which workstation the production will take place
- Button: Remove – Remove the production entry
- Button: Details – See the details of the production entry
- Button: Alarms – Set up alarms before the monitoring is started
- Button: Choose sensor – Select the correct device and start the monitoring
Quality Reports
The Quality Reports page lists all your finished productions.
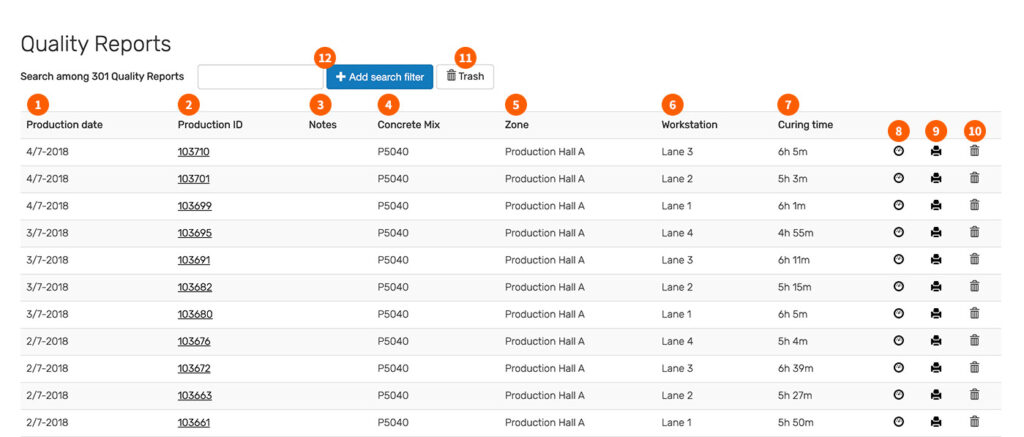
- Production date – The date the production was started
- Production ID – The name or unique ID of the production
- Notes – Additional info added
- Concrete Mix – The concrete mix calibration used
- Zone – In which zone the production took place
- Workstation – At which workstation the production took place
- Curing time – The time from first reading data to target strength reached
- Icon: Speedometer – Opens the report
- Icon: Printer – Print the report
- Icon: Trashcan – Move the report to the trash
- Button: Trash – See all the reports in the trash
- Search filter – Search through all of the reports using the search field
To open a report, click on its Production ID or on the speedometer icon to the right.
Example of a report
Below you see an example of a quality report:
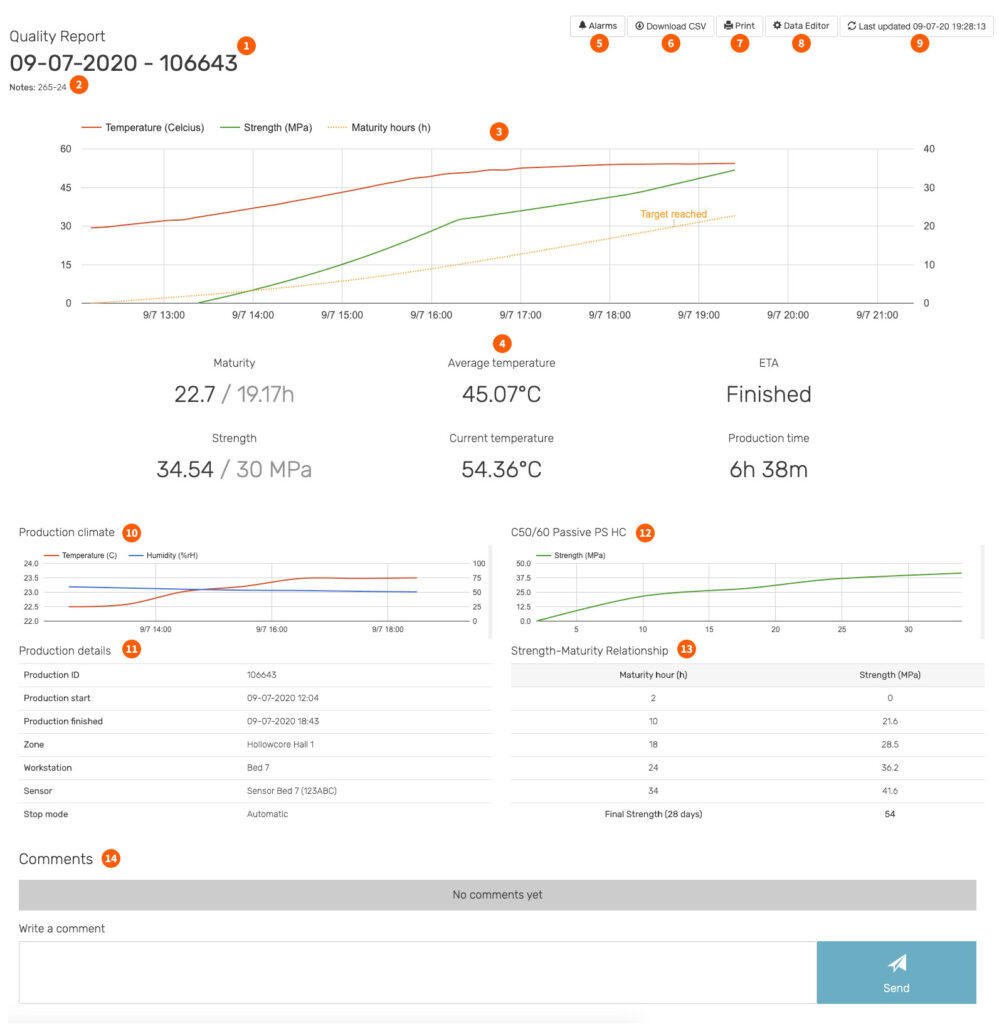
Each report includes:
- Title (production date and production ID)
- Notes
- Chart
- Key numbers
- Button: Alarms
- Button: Download CSV
- Button: Print
- Button: Data Editor
- Button: Update report
- Production climate chart (requires an Orbit 3 sensor)
- Production details
- Concrete mix maturity curve
- Concrete mix strength-maturity relationship
- Comments
Chart
The main chart shows the temperature history (red line), the maturity development (yellow line), and the strength development (green line).
The horizontal axis shows the date and time, the left vertical axis shows the temperature value, and the right vertical axis shows the maturity and strength value.
You can hover your mouse over the line charts to see the data at different times. Once the target is reached, the graph will indicate this and by hovering over it, you will see at which specific time the target was reached.
Key numbers
Below the chart you have some key numbers:
- Maturity – Shows the current maturity and target maturity
- Strength – Shows the current strength and target strength
- Average temperature – Shows the average temperature for the entire period
- Current temperature – Shows the current temperature (from the last reading)
- ETA – Shows the estimated time until target is reached
- Elapsed/Production time – Shows the curing time until target is reached
Alarms
You can easily set up alarms by clicking the Alarms button. Here you can choose between different alarm types, define an alarm limit, and choose receivers. You can set the alarm to trigger when the temperature goes below or above a certain temperature or to trigger when a certain maturity or strength is reached.
Export
You can both download the data as a CSV by clicking the Download CSV button or you can print the report by click Print.
Data Editor
The Data Editor can be used to:
- See the individual data points and temperature readings
- Select the start and stop time
- Change the chosen workstation, sensor, and stop mode
Changes in the Data Editor will be logged under Comments on the report.
Production climate
The quality report can include a chart showing temperature and relative humidity from your production environment. This requires that you install an Orbit 3 sensor in your facility and contact support to connect it to your reports. This way, the measurements from the temperature and humidity sensor, within the same time period, will be included as a small chart on the report.
Production details
This shows the different information in a table format, e.g. when the production was started and finished.
Concrete mix
The report includes the maturity calibration (maturity curve and strength-maturity relationship) that has been chosen for strength prediction of the production.
Comments
If you want, you can add comments to the report in the bottom. Simply write your comment in the field and press Send.
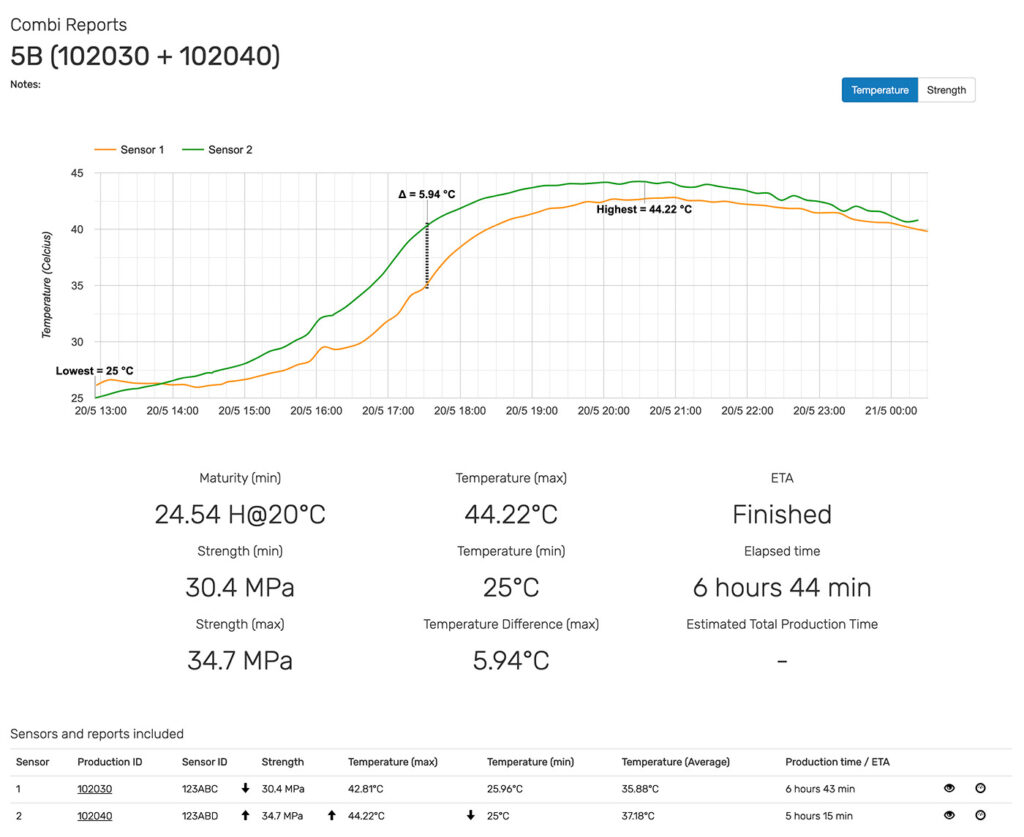
Combi Reports
The Combi Reports can be used to combine two or more productions that are monitored at the same time, e.g. if you are measuring at different positions in an element and would like to see the difference in temperature history and strength development and compare these.
Here is an example of a Combi Report that shows the temperature history for two different quality reports started at the same time:
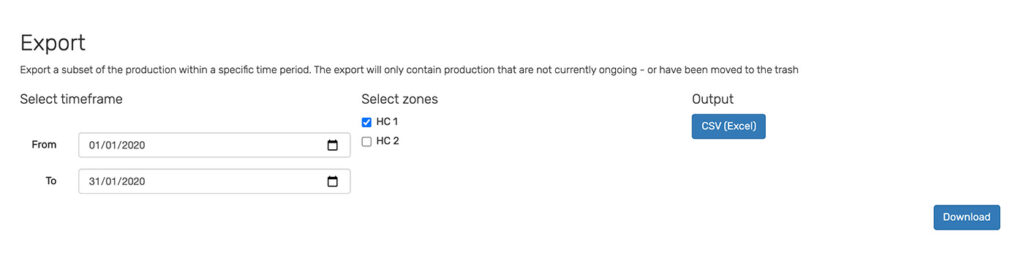
Export
On the page Export you can export an overview of all the productions you have done within a selected timeframe across chosen zones. The overview can be saved as a CSV-file and opened in e.g. Excel.
Facility
You must set up your precast plant on the Facility page. Here you can add zones – and within those zones add workstations. By doing this, you are defining where your precast products can be produced, and then select the right workstation when adding an entry in the Production Plan.
Statistics
The Statistics page show analytics and statistics across the different zones to give insight into your curing times across multiple productions. You can view:
- Number of productions
- Average production time
- Total production time
- Amount of work stations
- Daily capacity usage
- Compare workstations on average, fastest, and slowest production time
You can see the statistics for the last 10 days, a specific month, or a specific week.
Concrete Mixes
The Concrete Mixes is where you add your maturity calibrations for strength prediction.
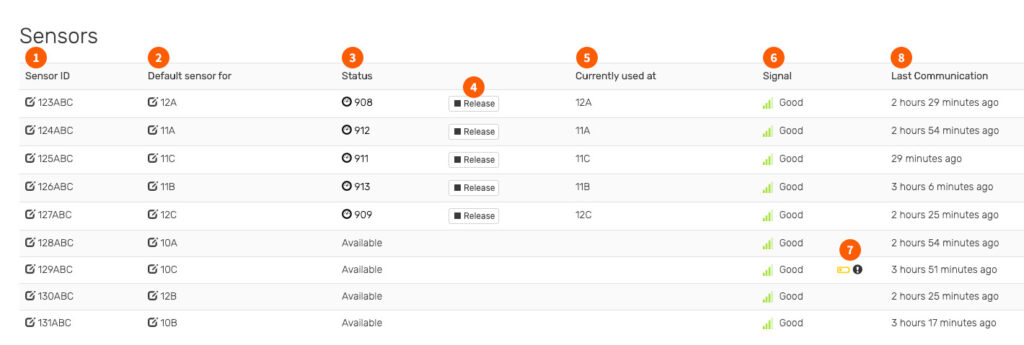
Sensors
The Sensors page gives you an overview of all your devices in a table.
Users
The Users page shows all the users who have access to the location. You can see the name, email, and mobile number, and you can invite new users to the location.
Locations
The Locations page gives you the ability to switch between your different locations, e.g. if your precast company has multiple plants at different locations. This way, users who needs to see data from multiple locations can access them from Locations in the menu.
Users who only have access to one location will just see their primary location.
Settings
The Settings page shows your details and software settings. Here you can set your language and timezone.
Questions? Please reach out to support in case you have any questions.