What is the Delta Timeline?
In Maturix, there is the option to add an additional axis which represents the delta hours. Delta hours is the amount of hours that have passed since starting the monitoring. Below, you can see an example of a maturity graph with the dual axis activated:
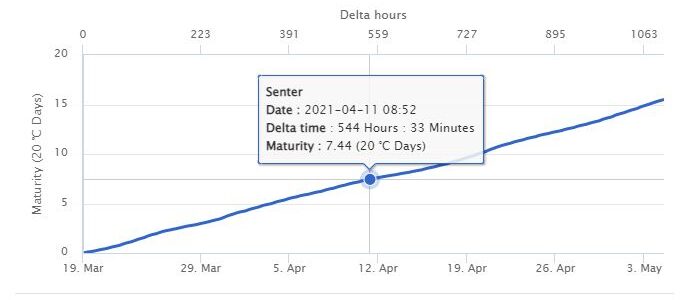
What to Use Delta Timeline For?
Having the dual axis activated, allows you to clearly see the amount of hours that it took to achieve a certain maturity. You could also compare the time that different casts took in order to achieve the same maturity or strength.
How to Activate It?
To activate this functionality:
- Go to User Settings and select the Settings tab.
- Click on the Enable delta timeline features toggle
- Click the Save changes button
- Your graphs should now show a double axis